Latitude N 52° 15' 52" Longitude E 359° 04' 42" Elevation 130 m
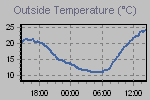
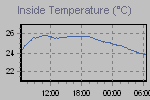
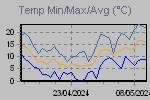
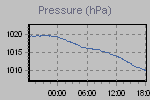
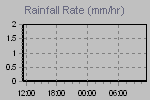
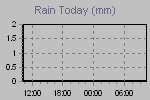
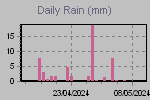
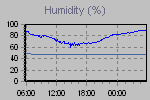
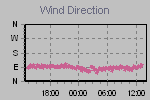
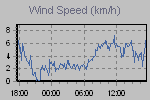
These graphs present the temperature, pressure, rainfall, and wind speed trends for the last 24 hours.
The thumbnail graphs are sampled every ten minutes. Click on a thumbnail to display the corresponding larger graph in the panel above it. The large graphs are sampled every minute.

| Click on a thumbnail to show a large graph in the panel above. | |||
 |
 |
 |
 |
 |
 |
 |
 |
 |
 |
||
| :now: :gauges: :today: :yesterday: :this month: :this year: :records: :trends | |||
Page updated 18/04/2024 23:10:01
powered by
Cumulus v1.9.4 (1097)